Gantt view

KPrimeSoft Support
Last Update vor 3 Jahren
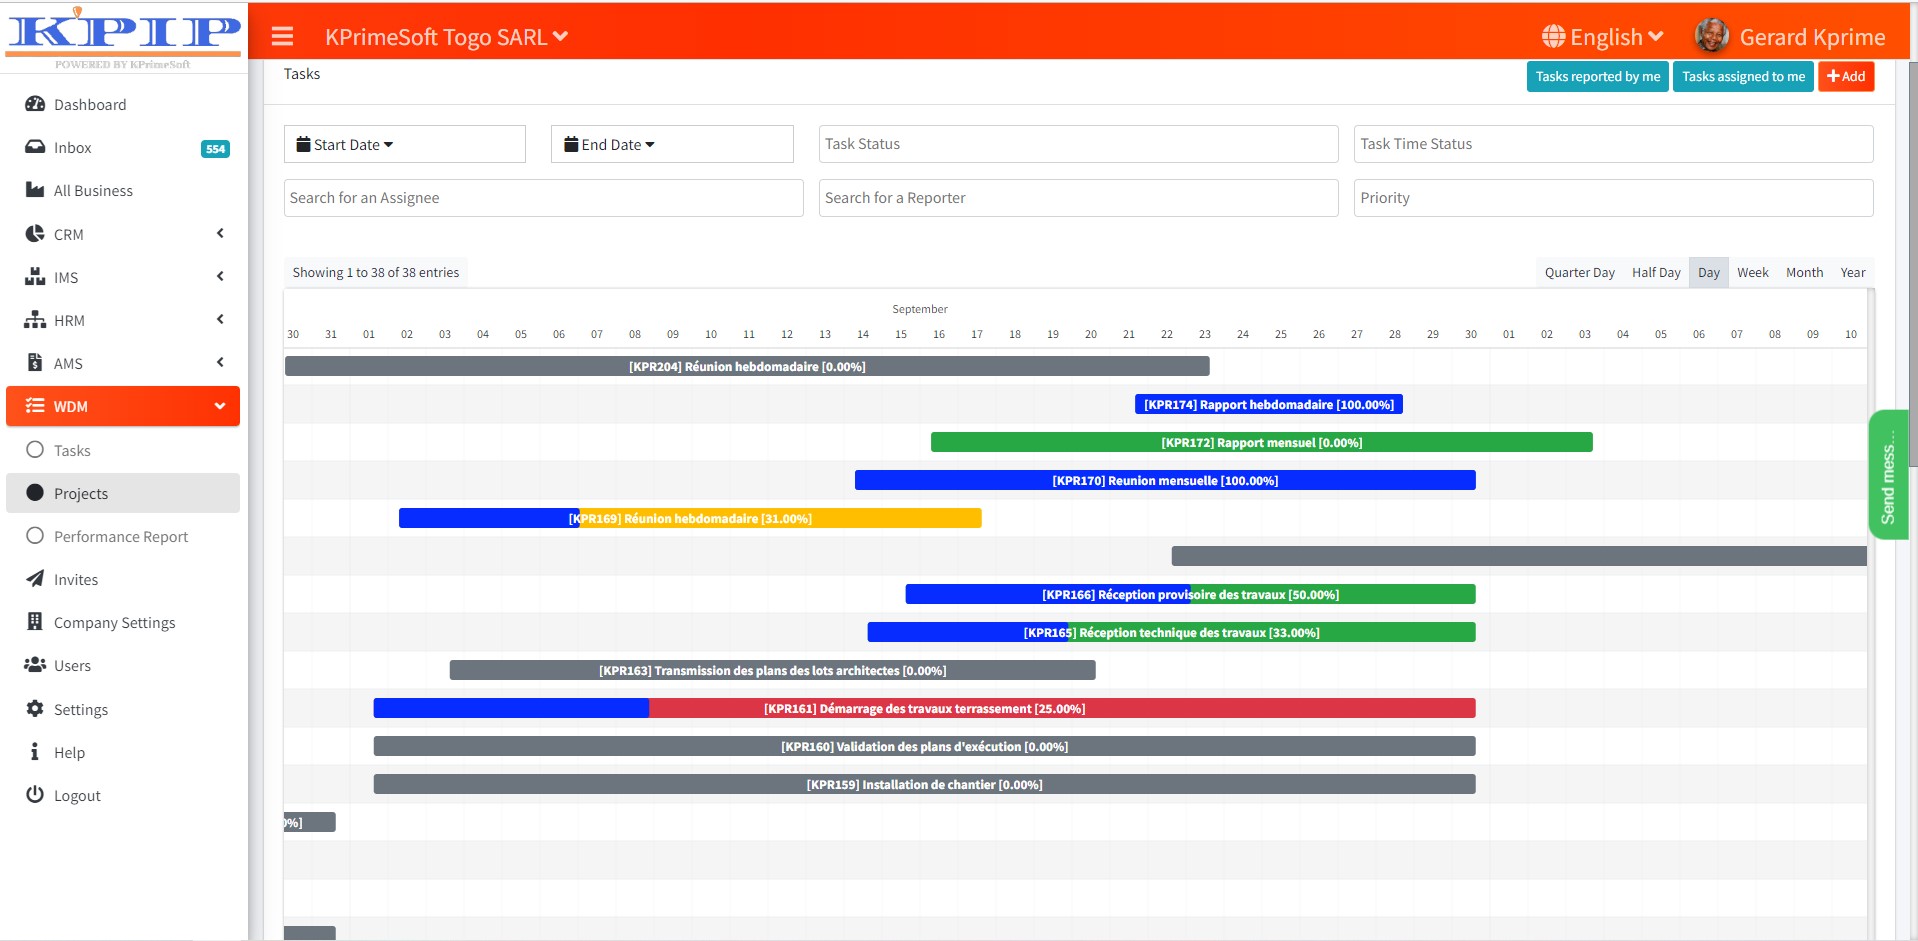
The Gantt Chart is one of the features offered by WDM, designed to enhance project management efficiency through task organization.
A Gantt Chart is a fundamental component of project management, serving as one of the most powerful tools for visually tracking the progress of various activities or tasks within a project. The chart comprehensively outlines all tasks required for the successful completion of the project, specifying the timeline for each. The chart employs a graphical representation to denote the deadlines for task completion. The horizontal axis of the Gantt chart is calibrated according to the project's time units, which can range from quarter-days and half-days to days, weeks, or even months.
This visual representation provides an immediate overview of:
🔸 The array of tasks that necessitate attention.
🔸 The precise commencement and culmination dates of each individual task.
🔸 The anticipated duration for each task's execution.
🔸 The overall project's start and finish dates.
In summary, the Gantt Chart is a pivotal tool within the arsenal of project management, offering a visual roadmap for understanding task timelines and project progression.
You've provided a comprehensive description of the benefits and versatility of using Gantt Charts in project management. Gantt Charts are indeed a valuable tool for tracking and managing project activities, regardless of the project's scope or complexity. They offer a visual representation of project tasks and their timelines, aiding in planning, monitoring, and communication. This tool helps project managers identify potential bottlenecks, risks, and delays, allowing for timely adjustments and better control over the project's progress. Gantt Charts also serve as a means to effectively communicate with the project team and stakeholders, ensuring everyone is on the same page regarding task statuses and project timelines. This tool's adaptability makes it suitable for a wide range of projects, from small initiatives to large-scale construction projects like roads, buildings, and even complex structures like nuclear power plants. Overall, Gantt Charts are a powerful asset in the project manager's toolkit for successful project execution and oversight.